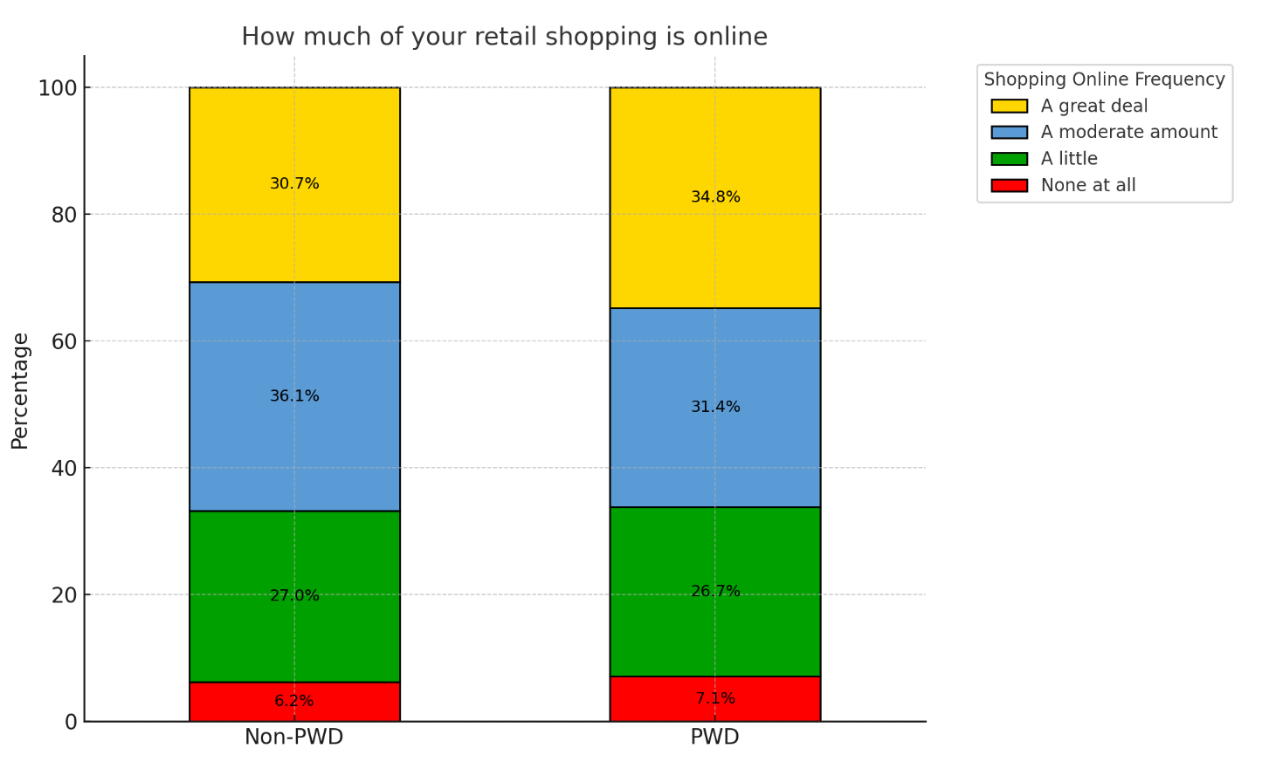
There is often an assumption that the shopping preferences and behaviors of Persons with Disabilities (PWD) are different from that of the non-disabled population. Last year, for example, Fable released a study indicating that PWD who use assistive technology (AT), shop online at nearly twice the rate of the general population.3
In contrast, in a survey of over 2000 US residents, split evenly among PWD and non-PWD, The Return on Disability Group (RoDG) asked a series of questions on retail, banking, and grocery habits.4 These questions included frequency of use and preferred channels. Survey findings revealed a consistent pattern: the behavior of PWD and non-PWD was almost always statistically the same, save a small increase in the frequency of digital retail over that of in-person shopping. (see Figure 1). In the RoDG survey, this increase in digital shopping was driven especially by those with physical disabilities pertaining to mobility, pain, and/or dexterity.

So, why such a difference in findings? Like so many customer insights, the difference comes down to who was asked.
Needless to say, disability is a broad demographic category, both in terms of disability type, its impact on day-to-day life, and potential assistive devices with which to interact with retail (and other) environments. However, the use frequency of specific AT can vary wildly, and some are unlikely to see much use outside a few specific disability-related types. The Fable study appears to rely primarily on screen-reader usage. Such technology use is quite infrequent: a working estimate for such usage amongst PWD is only about 2%.5 This would translate to be approximately 0.5% of the total population, assuming limited use outside of disability. For a survey such as that of RoDG, this frequency is so small that it is likely unobservable outside standard errors of margin.
In RoDG conversations with clients, many conversations of digital design are centered on the needs of those using assistive technology – almost always screen readers. Regulation often reinforces this conversation. However, getting this part of design right only represents a tiny fraction of designing for, and from, disability. To maximize impact on consumer experience, it is essential to understand use-cases from across disability, and from different types of assistive technology. This does not mean the needs of screen reader users should be ignored, rather, they should be seen as a small part of a larger design process meant to maximize useability across all potential consumers.
Ph.D., Managing Director of Research and Design at RoDG is an experienced researcher in the academic sector, who has conducted qualitative research with under-represented communities in multiple countries and in multiple languages. Drawing on years of research and advisory work with leading organizations—including major banks, telecommunications companies, and global consumer brands, Mark delivers actionable insights that help businesses unlock the full potential of the disability market.
RichDonovanCEO/Founder at RoDG is a globally recognized subject matter expert on the convergence of disability, user delight, and corporate profitability. He has spent more than 17 years defining and unlocking the economic value of the disability market. He is a person with a disability.
1 This document complies with all applicable EN 301 549, WCAG 2.0 and 2.1 Level A and Level AA guidelines for accessible digital documents. For alternative formats, contact Return on Disability at mark@rod-group.com
2 © The Return on Disability Group. All rights reserved. The information contained herein is not represented or warranted to be accurate, correct, complete or timely. This report is for information purposes only and should not be considered a solicitation to buy or sell any security.
3 See “Insights: The state of online shopping for people with disabilities” available at https://makeitfable.com/article/insights-the-state-of-online-shopping-for-people-with-disabilities/
4 Return on Disability survey, third quarter 2023. N=2200, divided between PWD and non-PWD.
5 Based on the Canadian Survey on Disability, 2017. Available at https://www150.statcan.gc.ca/n1/pub/89-654-x/89-654-x2021002-eng.htm. Calculation is based on 11.7% of respondents using a phone, tablet, watch, or computer with specialized software or adaptations due to their disability, and 16.4% of this segment having a device with a screen reader.
SHARE POST:
Grounded in users, Return on Disability delivers deep insights into your experiences. We translate new insights into design adjustments that delight from disability.

A current focus within many HR and accessibility offices is neurodiversity – a nonmedical term

A significant internal obstacle to internal accessibility – that for employees – is understanding potential

In 2023 Statistics Canada released results from the 2022 Canadian Survey on Disability (CSD).3 This
Lorem ipsum dolor sit amet till, consectetur adipicing elit till.