The Global Economics of Disability Report: 2024
SEPTEMBER 20, 2024
Table of Contents

This document complies with all applicable EN 301 549, WCAG
2.0 and 2.1 Level A and Level AA guidelines for accessible digital documents. For alternative formats, contact The Return on Disability at jenn@rod-group.com. We always strive for plain language; however, we often cannot write about conformance and compliance using simpler language without losing critical meaning.
Executive Summary
Executive Summary1
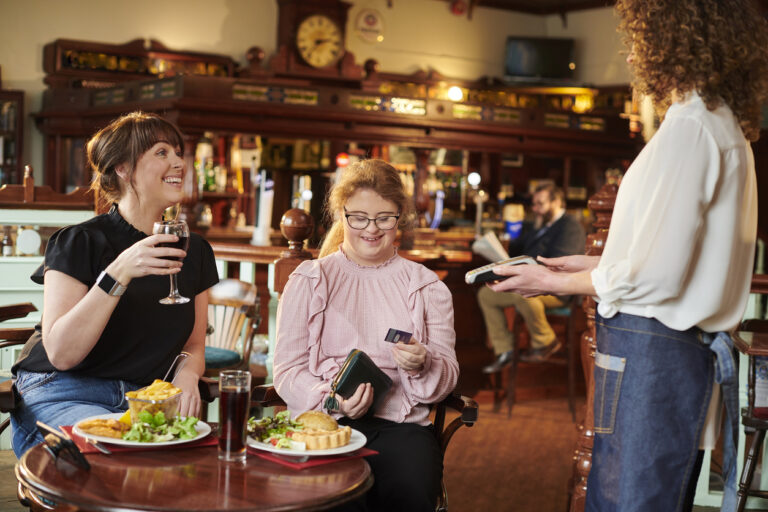
With an estimated disposable income of over $2.6 trillion,2 people with disabilities anchor the largest emerging market in the world. Long thought of as an economically poor demographic, the aging of the baby boomer generation and increased frequency of cognitive/mental health disabilities throughout the population ensures that discretionary spending will disproportionately touch disability over the next two decades.
The Return on Disability Group surveyed over 11,000 People with Disabilities.
Despite a growing recognition of market
potential, most organizations have failed to
capture value within disability. Unlike traditional
markets, disability is not constrained by
borders, languages, or culture. Rather,
it is a combination of functionality
and identity: how people interact with
their environment, and how they see
themselves. It is the functional aspect
of disability that is most important. How
people interact with products, services
and their delivery systems is what
is most important for organizations and their
design teams.
To date, most actions in disability markets have
focused on identity. This has largely been
in response to regulation and socio-political
activism. When functionality is considered, it
typically begins and ends with a ramp and an
automated door. Necessary features, but ones
that fail to address most functional requirements
of People with Disabilities (PWD). Perhaps even
more critically, these simplistic steps fail to
generate broader downstream benefits in the
non-PWD marketplace. Most disability is nonapparent. Cognitive/mental health disabilities are
the fastest growing disability types.
Getting disability right means designing from the
functional experience of People with Disabilities
in a way that captures both disability and
the general market: not “just” the 22% of the
population that disability represents. To date,
1.6 billion
People in the world currently
have a disability
>$2.6 trillion
Total disposable income of
PWD (USD) in North America
and Europe alone
USA:
$1.3 trillion
Total disposable income of
People with Disabilities (USD)
Global Disability Market:
$18.3 trillion
PWD + Friends and Family
1 © The Return on Disability Group. All rights reserved. Redistribution is prohibited unless provided in writing by The Return on Disability Group. This report is for information purposes only and should not be considered a solicitation to buy or sell any security.
2 $2.6 trillion USD represents the disposable income of those with disabilities aged 25-64 in Canada, the E.U., U.K., and U.S. alone.
2
Global Economics of Disability Report: 2024 | The Return on Disability Group

only the largest technology companies – such
as Alphabet and Apple – have succeeded in
leveraging disability to improve experiences for
broader consumers. They do this for one simple
reason: a better experience results in higher
revenue.
To execute on this strategy, organizations must
embed user insights from disability directly into
their design processes, aligned with design for
non-PWD customers. Doing so allows for the
greatest potential market capture by embedding
ease of use across a product or service
ecosystem. Getting the data right is both critical
and the most common gap in design today.
Shifting to this user-centric approach requires
action. The greatest opportunity in disability
markets has begun, as the wealthiest generation
is aging into disability. To respond
to discovered demand, new
action by leading organizations is
required. Competitive organizations
must develop new user research
approaches, new design inputs –
and most importantly – their senior
leaders must allocate resources and instill
accountability. There remains a small window to
lead, but this will close unless leaders choose to
act immediately. Those seeking to reduce their
risk by following established leaders must start
learning and acting now.
“Gen-pop” is defined as People without disabilities.
22%
Percentage of global population (5+)
with a disability
22%
Percentage of global working age
population (25-64) with a disability
27%
Percentage of global consumer
population (15+) with a disability
Factoring in their friends
and family, disability touches
63%
of the global population
3
Global Economics of Disability Report: 2024 | The Return on Disability Group
How to Use this Document
How to Use this Document
This document is intended to assist business leaders, policy makers, and entrepreneurs unlock the value of the disability marketplace – an emerging market representing over $2.6 trillion of disposable income in the United States, United Kingdom, European Union, and Canada alone. This market crosses geographic, linguistic, gender, age, and class boundaries, making it a source of misunderstood value, both as a consumer base and talent pool.
To help unlock value, this report re-orients
the reader away from diversity, equity, and
inclusion (DEI) and advocacy, and towards one
of experience-driven design. Design for both
customers and employees. Doing so positions
leaders to cultivate delight: the key ingredient
to build loyalty, drive purchase decisions, and
maximize employee engagement. The insights
here are not solely intended to maximize
consumer revenue and employee engagement
within disability. Rather, this report is intended
to push its reader to think of designing from
disability, with direct effects on ease of use that
extends to all users.
This report, on its own, does not create value
for you. Rather, it should be used as a departure
point to disrupt how you and your organization
think about, design for, and ultimately delight
your core customer and talent base. Disability
represents over 25% of your customers and
over 20% of your talent. Minimum. Action must
flow from board and senior leadership down
to customer and talent facing teams – not
compliance or DEI.
Those familiar with previous versions of this
document will notice significant change. The
market is evolving – and so is the report.
Previous versions focused primarily on the macrolevel. While valuable, an increasing
number of firms are realizing the value
of this marketplace. It is time to dig
deeper.
Since our last global report in 2020,
The Return on Disability Group (RoDG)
has surveyed over 11,000 People with
Disabilities (PWD), and engaged over
1,000 PWD in qualitative research. We
have advised executives, designers,
and researchers across industries.
From this work, RoDG can conclude that
unlocking the value in this market is focused on
designing great experiences for actual customers
and employees. This is the focus of this report.
We invite you to read on and visualize your first
steps to unlock the value of a marketplace worth
over $2.6 trillion.
This report is intended to push its reader to think of designing from disability, with direct effects on ease of use that extends to all users.
5
Global Economics of Disability Report: 2024 | The Return on Disability Group
Introduction to the Disability Market
Introduction to the Disability Market
Defining Disability
Leaders often initially struggle with the size of the disability market. 22% of the total population simply seems too large. “If disability is so large,” they ask, “why don’t I see it every day?” A reasonable and rational question. The answer is two-fold. First, and most importantly, is the difference between functionality and identity. Second, is variation in how apparent a given persons’ disability is relative to our expectations. Both are key inputs to designing for, and from, disability.
Functionality and Identity
At its core, disability consists of two things:
functionality and identity. Functionality refers to
the approach to perform a given task relative to
the “norm”. This can include the manipulation of
objects using hands. The capacity to see, hear, or
speak. The ease of mobility. The ease to process
information. The way one interacts with people.
Identity refers to how individuals see themselves.
Based on experience and/or self-perception, an
individual may perceive themselves as having
a disability or being disabled. Disability, in the
context of experience, does not require any
formal medical diagnosis to be activated.
Differences in functionality frequently qualify
an individual as being disabled without them
assuming the identity of disability. A person with
a nagging injury that prevents them from climbing
long flights of stairs may not see themselves as
disabled, but in a functional sense, their demands
are amplified from the norm. This is especially
true with age, as people attribute changes in
functionality to the ageing process, not disability
per se.
Identity is more complex. Lived functional
difference may lead to an individual identifying
as disabled. The same is true for a medical
diagnosis, workplace experience, or social
interaction. Having an identity (or not) as disabled
can be related to generational and/or cultural
differences, especially across disability types.
RoDG research has consistently found that the
self-identification with cognitive or
mental health disabilities decreases
with age, even though the medical
prevalence of said disabilities
increases in this cohort. Identity and
functionality do not always align.
From a design standpoint, the value in disability
is overwhelmingly tied to functionality rather than
identity. The reason is scale. Functionality can
align with how the general population consumes
products or experiences. A firm that designs
products to the needs of a user that functionally
struggles to consume complex information will
inherently make a product that is easier to use
by all.
In this paper, it should be emphasized that the
disability market is based on functional disability,
not self-identity. This is consistent with the
Statistics Canada approach of data collection,
which RoDG uses to estimate the size of the
global disability market.
70% of disabilites are non-apparent.
7
Global Economics of Disability Report: 2024 | The Return on Disability Group
Approximately 756 million working aged people (25- 64) currently have
a disability globally. This represents 22% of the working age population.
Disability Apparentness
The second dimension leading people to
underestimate the size of the disability market
is how many disabilities are non-
apparent. Only about 30% of the
disability population has an apparent
disability. The remaining 70% have
less apparent disabilities.3 The
most apparent disabilities are often
accompanied by assistive equipment,
such as a wheelchair or a white cane.
Users of these tools represent a small
minority of the overall disability market,
yet the visual image dominates the
perception of disability. It should be
noted that disability type and the apparentness of
a disability are not directly correlated.
Disability Market Size and Spending
Market Demographics
There are approximately 1.58 billion people
globally that have a disability.4 This represents about 22% of the world’s population.5 In Canada, Europe, and the United States, there are approximately 273 million people with disabilities. While disability rates are highest in seniors,
a significant proportion of the working age population also has a disability. Approximately
756 million working aged people (25-64) currently have a disability globally. This represents 22% of
the working age population.
The disability population is growing. This growth
is not driven only by seniors. By 2030, over
1 billion working aged persons (25-64) will
have a disability. This is a product of global
population growth. This will be a material source
of consumer spending and productive labor for
decades to come.
Spending Power
Disability is frequently associated with poverty
and unemployment. This is not reality. While
incomes and labor force participation rates are relatively lower among PWD, their spending
power is considerable.6 In the US alone, PWD control $1.3 trillion USD of disposable income annually. This does not include accumulated
wealth: a key factor given that disability rates increase with age. In addition to the US, PWD in Canada, the EU, and UK control an additional $1.4 trillion in annual disposable income.7
Friends and Family
The disability market stretches beyond those
that manage functional disabilities. It also directly touches those with close personal relationships
to PWD: friends and family. These individuals are affected by the consumer/employee experience
of PWD, and make brand choices accordingly. Preliminary research shows friends and family
have expressed an intent to switch their spend
away from poor experiences or acting as brand ambassadors, depending on the experience
relative to disability.
3 U.S. Census Bureau Current Population Report: Americans With Disabilities: 2002 (P70-107) by Erika Steinmetz
4 Statistics Canada, Canadian Survey on Disability 2022 (https://www150.statcan.gc.ca/n1/daily-quotidien/231201/dq231201b-eng.htm); Statistics Canada, Participation and Activity Limitation Survey, 2001 and 2006 (https://www150.statcan.gc.ca/n1/pub/89-628-x/2008004/t/5201211-eng.htm); United Nations, Department of Economic and Social Affairs, Population Division, 2024 (https://population.un.org/dataportal/). This population refers to the global population aged 5+.
5 Aged 5+
6 For example, in Canada working aged PWD have a labor force participation rate of 69.6%, compared to 84.8% for those without disabilities. See Statistics Canada, Canadian Survey on Disability 2022
7 Note that these income figures do not include Asia, Africa and Latin America due to inherent difficulties in assessing incomes in these regions.
8
Global Economics of Disability Report: 2024 | The Return on Disability Group
Figure 1: Opportunity in Disability
People with
Disabilities (PWD)
People without Disabilities
Friends & Family
Broader Market
6.6%
Apparent
(30% of
PWD)
15.4%
Less Apparent (70% of
PWD)
41%
Friends
& Family
37%
Broader Market
Opportunity
Only about 30% of the
disability population
has an apparent
disability.
The remaining
70% have
less apparent disabilities.
“Evangelists” Ready
to act and “preach” to
others about the value
inherent in People with Disabilities.
Everyone benefits from innovations and insights derived from disability.
Design for All = Scale
With a conservative estimate of each PWD
having 1.85 friends or close family members, the disability market directly touches an additional
2.9 billion individuals globally – 41%8 of the global
population – with a spending power of over $15 trillion USD in Canada, the EU, UK, and US alone.9
Figure 2: Disability Market Population and Incomes
| Canada | US | UK and EU | Global Total | |
|---|---|---|---|---|
| PWD Total | 9 million | 77 million | 125 million | 1.58 billion |
| PWD Disposable Income (USD) | $100 billion | $1.3 trillion | $1.3 trillion | N/A |
| Friends and Family Total | 17 million | 142 million | 232 million | 2.9 billion |
| Friends and Family Disposable Income (USD) | $580 billion | $7 trillion | $7.8 trillion | N/A |
| Total Disposable Income (USD) | $680 billion | $8.3 trillion | $9.1 trillion | N/A |
8 Aged 5+
9 PWD disposable incomes have been adjusted lower than general population based on ratio differences in median income according to disability functionality in Canada and relative rates of labor force participation between PWD and non-PWD. PWD population calculated using only 25-64 age cohort for purposes of
assessing total and disposable income.
9
Global Economics of Disability Report: 2024 | The Return on Disability Group
Half of global new consumers, and consumer growth, will come from those aged 50+ in 2025.
Demographic Changes from the 2020 Report
Readers may note that these numbers differ from
previous iterations of this report. There are two
reasons for this. First, this report uses the 2022
Canadian Survey on Disability (CSD), conducted
by Statistics Canada, to create its base disability
frequency by age and gender groups. Updated
since the release of the previous RoDG report,
there have been changes in disability frequency
within these categories. The CSD was used
to calculate new base frequencies for global
disability as its criteria for assessing disability are
related to functional ability to perform certain
everyday tasks, rather than self-identifying as
disabled. Thus, it is less affected by stigma
surrounding disability disclosure.10
The second reason for the change
in disability population is that the
approach used in this 2024 report
results in a more granular set of data
on disability frequency across age and
gender categories. The 2020 version
of this report applied aggregate
disability rates to aggregate population.
This report breaks down disability frequency by
age and gender, and applies different disability
rates to each, based on the CSD. While this
led to little change in Canada, Europe, and the
United States, it did lead to a reduction in global
totals due to the significantly younger average
population in the Global South.
Demographic Shifts: Boomers and
Cognitive Disability (Mental Health)
Two significant shifts are underway that will
significantly alter the disability marketplace – in
ways that increase its relevance to the economy.
The first is an aging effect for a uniquely wealthy
generation. The second is increased frequency
of, and identification with, cognitive and mental
health related disabilities.
Baby Boomers
Those born between 1946-1964, the “Baby
Boomers”, are the wealthiest generation in
human history. In the United States alone, this
generation has a net worth of $78.55 trillion
USD.11 Based on the disability frequency rates
collected by Statistics Canada, over one third of
those in this generation will have a disability by
the time they retire. The frequency of disability
in this population will only continue to increase
over time.
Baby Boomers have not faded away in retirement.
At the forefront of transformational changes in our
economy and society, this generation continues
to assert themselves, spend, and enjoy their
twilight years. World Data Lab projects that half of
the global new consumers, and consumer growth,
will come from those aged 50+ in 2025.12
Organizations that can capitalize on this growing
demand are well positioned for significant returns.
Cognitive Disability Emergence
(including Mental Health)
The fastest growing disability categories are
those related to mental health and cognitive
disability. In the 2022 Canadian Survey on
Disability, reported rates of mental health related
disability increased by 8% in the 15-24 and
25-64 age cohorts in Canada. Similarly in the
United States, the most frequently self-identified
disability type according to the Center for
Disease Control is now cognitive, with 13.9% of
the US population identifying as such.13
The existing size and growth of cognitive
disabilities at a greater size and rate than
other disability types requires a shift in how
organizations approach disability, both as a pool
of talent and as consumers. Their demands are
different than automated doors, ramps, and
built environment concerns that have long
been the dominant and capital-intensive focus
10 Please refer to the supplementary appendix for a more detailed discussion for why this measure was chosen for base frequency.
11 Board of Governors of the Federal Reserve System, Distribution of Household Wealth in the U.S. since 1989 (https://www.federalreserve.gov/releases/z1/dataviz/dfa/distribute/chart/)
12 World Data Lab. 2024. The World Consumer Outlook 2025 (https://worlddata.io/world-consumer-outlook/)
13 Centers for Disease Control and Prevention, Disability and Health Data System (DHDS) [updated 2024 July; cited 2024 July 15] (http://dhds.cdc.gov); Statistics Canada, Canadian Survey on Disability 2022
10
Global Economics of Disability Report: 2024 | The Return on Disability Group
within disability. As younger age cohorts assert
themselves as consumers and talent, designing
for cognitive functional needs is essential for
sustainable organizational growth.
The functional needs of this growing cognitive
disability demographic are likely to be similar to
those of Baby Boomers. As Boomers age, they
acquire the cognitive functional disabilities. This
represents an opportunity to develop immediate
and sustainable market growth strategies
targeting both older and younger users for scale.
Disability “Types”, Market Opportunities, and the role of Regulation
Different disabilities occur with different
frequencies in a population. Some disabilities
also map more closely to the functional
requirements of the general population. The
functional needs of cognitive disabilities can
include simple and clear information/instructions,
additional use of iconography, and simplified
process. These have clear benefits outside
disability, impacting both revenue and cost. The
same is true for easier mobility and wayfinding,
larger fonts for ease of reading – especially at
a distance. Designing for these functionalities
improves ease of use, and thus experience, for
all customers. The scale and nature of these
disability types more easily allow market forces
to shape experience for these customers and
employees.
Certain functionalities reflect needs distinct from
the general population and occur with relatively
low frequency. This makes these disability
“types” more difficult to design for in a way that
directly increases revenue relative to the cost
of development. One example of this is broad
design for users with both limited vision and
hearing. These Deafblind individuals make up
less than 1% of the population. Designing for this
specific set of functional requirements may not
create value at a scale similar to more frequently
occurring disability types.
In cases where specific disability types are less
frequent and/or consist of demands which are
not supported by market forces, it is essential
for governments to create – and enforce –
accessibility regulation. Without regulation,
organizations may abandon designing for
these functionalities, having little incentive to
do so. Regulation thus has a role even when
organizations understand the disability market.
However, it is essential to underscore that
adherence to regulations only helps avoid risk.
Organizations do not succeed in this, or any
market by conflating regulatory compliance with
good design.
Effective regulations are experience based,
helping markets fill experience gaps that are not
supported by profitable actions. Today, disability
regulation regimes fit two broad categories:
standards-based and litigation-based. Neither
regimes have met their promise to PWD. Going
forward, global governments must adjust the
basket to include explicit funding mechanisms to
incentivize action. The target must be to improve
outcomes within experience gaps where high
barriers impact too few users to allow the market
to act independently.
Conclusion
While our estimates of the disability market
have changed since the 2020 version of this
report, the overall picture is the same: disability
represents a source of material unrealized
revenue and talent (productivity) for organizations.
The market is also growing, both in population
and wealth.
Designing for the disability market not only
allows capture within the market itself, but also
caters to the demands of friends and family. The
biggest opportunity, is in leveraging the amplified
functional needs of disability to design for easier
use experiences for the general population.
11
Global Economics of Disability Report: 2024 | The Return on Disability Group
Disability Market Trends
Disability Market Trends
At the macro-level, disability trends are similar to those in the 2020 report, insofar as the companies most adept at capturing value in the disability market are large technology companies. Like 2020,
most organizations also fail to act materially in this marketplace, save for minimal regulatory
compliance. Rather than offering a repeat of this analysis, RoDG encourages readers to review the
2020 report for a macro-level analysis of disability.
PWD consumers consistently describe the Apple retail store as a great experience, because it embodies a servicefirst mindset that overcomes nearly all challenges a potential consumer may face, independent of functionality.
Today, our team assessed these market trends:
disability-specific products, where disability
most frequently “resides” in organizations,
accommodations and disclosure, emerging
regulatory frameworks, the effects of Covid-19,
and the growth of Artificial Intelligence.
Highest Performers are in
Technology
Like previous years, the highest performers in
disability are large tech companies, who (not
coincidentally) dominate market performance
more generally. Alphabet (formerly known as
Google), Amazon, and Apple all continue to drive
exceptional value in disability.
The reason for this is simple: an ethos that
embeds ease of use early in design processes,
with senior leaders being accountable for
performance. Unlike most firms, whose actions
are primarily a response to regulators, these
organizations embed accessibility into their core
product offerings, with few accessibility “add-ons”
or “workarounds”. For all, their products/services
“just work” for users – from ordering, to packaging,
to information architecture.
Skeptics may point to the largely digital nature
of these organizations; however, the Apple retail
store is a case in point of embedding ease of
use within its core operations. PWD consumers
consistently describe the Apple retail store as a
great experience, because it embodies a service-
first mindset that overcomes nearly all challenges
a potential consumer may face, independent of
functionality. Dedicated agents ensure products
are found, questions answered, and where
necessary, products are unboxed so all users can
explore their purchasing options.
Functionality-Specific
Products
Amongst large retailers, there are
emerging attempts to address the
specific demands of PWD by creating
or merchandising functionally specific
products. These include railings and
handles to be installed in the home
to assist mobility, kitchen tools for
those with limited dexterity – such as
ergonomic can openers, reaching tools,
and adaptive clothing lines for those
using wheelchairs.
A few preliminary observations can be
made on these products. First, they vary wildly in
their potential market reach. While an ergonomic
can opener may offer universal appeal, clothing
designed specifically to delight wheelchair users
is limited in its market to approximately 1% of the
population14 – a relatively low value proposition
to producers without charging cost-prohibitive
price points. It is also unclear whether adaptive
fashion is demanded by the intended user or if
this is a solution in search of a problem.
14 See Smith et al. 2016. “Prevalence of Wheelchair and Scooter Use Among Com-
munity-Dwelling Canadians” Physical Therapy 96(8): 1135-1142; World Health Orga-
nization Regional Office for South-East Asia Fact Sheet on Wheelchair available at https://iris.who.int/bitstream/handle/10665/205041/B4616.pdf?sequence=1&isAllowed=y
13
Global Economics of Disability Report: 2024 | The Return on Disability Group
DEI teams rarely have budgets for design work, nor do they typically have design capabilities “in house”.
Second, there is no standard terminology
through which to market functionality-specific
products. Potential consumers can only locate
many of these products by happenstance. In our
conversations with PWD, many who use such
products first discovered them only by accident,
when shopping for “standard” versions of the
same item.
Where Disability “Resides” in Complex Organizations
A reason many organizations struggle to
generate returns in the disability market is that
disability is frequently situated far from customer
and employee experience. Instead,
disability typically resides within DEI
offices – an organizational decision
that limits opportunities for revenue
capture.
Recall that, at its core, disability
consists of functionality and identity,
with the former being the key
driver of day-to-day experience in
products, services, and careers. While DEI can
perform valuable functions in terms of shifting
organizational culture, functionality itself resides
outside of culture per se. This means that
even if DEI is able to get the identity elements
right – eliminating stigma surrounding disability,
or improving branding – there still will not be
changes in the functional nature of products
or services without product or service teams
substantively leading the charge.
Organizations that succeed in maximizing the
value of the disability market embed disability
directly into their consumer and employee
experience teams. The reason for this is simple:
to get functionality right, it must be used as an
input at early stages of the design process. This
is only possible when disability gets “pushed”
down to design teams, and when their design
decisions are held accountable by customer
and employee experience leaders. This is how
market leaders continue to get disability right. It
is not an add-on or a checklist: it is embedded in
how they design. Everything. Through doing so,
these organizations not only capture disability
functionality, but also uncover ways to streamline
processes and improve ease of use across their
customer base.
This should not be read as a frontal assault on
DEI. In conversation with DEI leaders across
large organizations, they frequently describe
challenges of pushing disability into design
teams, knowing this is critical for execution. Their
challenges are twofold: budget and coordination.
DEI teams rarely have budgets for design work,
nor do they typically have design capabilities
“in house”.
DEI can serve an important role in disability, but
this “D” is not for “design”. This inhibits their
ability to embed functional needs sufficiently
upstream in design cycles to maximize value.
Workplace Practices
Data and Disclosure
Many organizations continue to be focused
on collecting internal disability statistics via
disclosure. This frequently destroys value and
limits employee engagement. The reason is
simple: stigma surrounding disability provides
a significant disincentive to disclose. Studies
on workplace disclosure generally agree that
many see disclosure as leading to potentially
negative professional consequences. In one
study of workplace disclosures, nearly 75%
of surveyed PWD reported that risk of job
loss or not being hired was a “very important”
consideration on their decision to disclose.
Over 60% also responded that the potential for
limited promotion opportunities was also “very
important”.15
These issues cause workers to avoid disclosure
practices altogether. In turn, organizations
frequently undercount the number of PWD in
their workforce and use this number as an excuse
to limit internal disability initiatives.
15 Sarah von Schrader, Valerie Malzer, and Susanne M. Bruyère. 2014. “Perspectives on Disability Disclosure: The Importance of Employer Practices and Workplace Climate”, Employee Responsibilities and Rights Journal, 26(4): 237-255.
14
Global Economics of Disability Report: 2024 | The Return on Disability Group
Given the need to collect disclosure due to
outdated regulatory requirements, one tool to
better capture internal disability demographics
is to leverage expert third parties to conduct
internal research. This removes concerns over
anonymity and potential stigma. RoDG has
provided such services for clients, resulting
in disclosure rates 5x that of internally
generated data.
Workplace Accommodations
Internally, accommodations are the most frequent
focus of disability initiatives. Understanding
this process is one of the greatest missed
opportunities to leverage learnings from
disability to drive efficiencies throughout a
workforce. In practice, both intended eligibility
and the application process limits opportunities
to maximize workplace engagement and
productivity – not just for PWD, but for all
employees.
Accommodations can benefit more workers
than those that have a functional need caused
by disability. In one RoDG survey comparing
workplace engagement in the United States,
17% of those without disabilities indicated they
would “probably” or “definitely” benefit from an
accommodation at work. Of this group, over 70%
indicated they thought said accommodations
would increase their productivity by 16% or
more.16 These numbers were even larger for
self-identified PWD. These “unmet” needs reduce
overall productivity in the workforce – increasing
labor costs for employers. An RoDG survey with
Canadian respondents returned similar results.
It is the process of requesting accommodations
that most limits employees – with and without
disabilities – in receiving them. In the RoDG’s US
work engagement survey, only 10% of those who
perceived they would benefit from an unrealized
accommodation, indicated that they had an
accommodation request denied. The other
90% of respondents experienced a breakdown
earlier in the process – from not knowing how
to request, to belief it would be denied, to being
uncomfortable requesting (among others). Data
from RoDG’s Canadian workplace engagement
survey showed a similar pattern.
Accommodation costs are frequently far less
than most organizations anticipate. In the most
recent American Job Accommodation Survey,
56% of employers indicated the accommodation
for their employee that needed it cost nothing.
39% indicated a one-time expense, with a median
cost of $500. Only 4% of accommodations
incurred an annual cost to the company.17
Consistent in RoDG research is that the most
common accommodation requests
are flexible scheduling and workplace
arrangements. This is true for both
PWD and non-PWD.
Workplaces are bleeding employee
engagement through their
accommodation processes, for those
with and without disabilities. They
are also missing out on downstream
benefits. For example, over 50% of
employers in the most recent American Job
Accommodation Network survey indicated
that providing accommodations increased
overall company morale, while 49% indicated
it increased company productivity overall. 46%
also indicated accommodations increased safety.
In 90% of cases, accommodations allowed a
company to retain a valued employee.18
Regulatory Frameworks
Since the last publication of this report, there
have been two noteworthy developments in
accessibility regulation. First, in Canada, the
Accessible Canada Act, has led to increased
consultations with PWD across federally
regulated entities and the federal public service.
Second, in response to a number of public
accessibility failures, legislators in Canada, the
90% of people – with and without disabilities – indicated their accommodation process broke down prior to a request being made.
16 Return on Disability Group. 2023. Accommodations and Employee Engagement Survey. N=2000 (1000 PWD, 1000 non-PWD).
17 Job Accommodation Network (Updated 10/19/2020). Workplace accommodations: Low cost, high impact. Retrieved 03/03/2023, from https://askjan.org/topics/costs.cfm
18 Ibid.
15
Global Economics of Disability Report: 2024 | The Return on Disability Group
United States, and Europe are in the process
of introducing and/or reinforcing accessibility
legislation as it pertains to air travel.
The Accessible Canada Act
Signed into law in 2019, the Accessible Canada
Act (ACA) was developed as part of a process
to make Canada barrier-free by January 1, 2040.
The ACA requires federally regulated entities and
crown corporations to participate in continuous
3-year planning/progress cycles. This involves the
release of a new public accessibility plan in year
one, and public annual progress reports on this
plan in the subsequent two years, before starting
the cycle anew. This first reporting cycle began
in 2023, and those subject to the ACA published
their first progress reports in June 2024.
What separates the ACA from previous regimes
is that it requires consultations with PWD for
both plans and progress reports. Moreover, the
ACA currently does not provide strict direction or
standards to affected organizations, leaving them
room to define their accessibility commitments as
most benefits their business operations.
Taken together, this means ACA-compliant
organizations can leverage consultations
to conduct market and UX research on a
demographic that accounts for ~20% of their
employees and 27% of their customers. They can
then prioritize addressing experience barriers
that have the greatest impact on revenue-driving
indicators such as ease of online purchase,
wayfinding, and employee engagement.
Crucially, it helps organizations see beyond built
environments – an element of accessibility that is
so capital intensive that it often drowns out higher
value propositions in this space.
Most importantly, the ACA has the potential to
be a unique piece of disability legislation to push
businesses towards the user input, design, iterate
approach that they would use for any other
consumer demographic. RoDG recommends
other organizations develop such an iterative,
user-centric approach regardless of regulatory
incentives.
The Aviation Sector
Since the 2020 disability report, the most
significant changes in regulation have been in the
aviation sector. Driven by a series of high-profile
customer experience failures for passengers
requiring mobility assistance, Canada, the U.S.
and E.U. have enacted or proposed legislation
to improve the experience of passengers with
disabilities.
The focus of these new legislative initiatives
is predominantly those with mobility-related
disabilities and the safe transport of mobility
aids.19 This includes new spatial and accessibility
requirements for aircraft lavatories on select
aircraft types, enhanced compensation
requirements for damaged mobility aids, and
enhanced notification for when mobility aids
cannot be safely transported on a given aircraft.
In addition, an Accessibility in Aviation summit
in Canada, and proposed amendments to
Regulation EC261/2004 in the E.U., have both
emphasized better collection of passenger
experience data in accessibility. Like with
the ACA, RoDG recommends such efforts be
consistently applied across organizations to
the experience of travelers, not merely the
accessibility of buildings and aircraft. Without
data, good design is a matter of guesswork and
luck, not process.
Covid Effects
The Covid-19 Pandemic continues to have
significant downstream effects in ways that shape
the disability marketplace for both consumers
and employees. This includes the market itself,
consumer behavior, and contemporary debates
about working arrangements.
19 Prominent examples include potential the Airline Passengers with Disabilities Bill of Rights in the U.S. See U.S. Department of Transportation. 2024. Secretary Buttigieg Announces Proposed Rule to Ensure Passengers Who Use Wheelchairs Can Fly with Dignity. (https://www.transportation.gov/briefing-room/secretary-buttigieg-announces-proposed-rule-ensure-passengers-who-use-wheelchairs-can)
16
Global Economics of Disability Report: 2024 | The Return on Disability Group
Covid-19 and Disability
While the long-term effects of Covid-19 are still
under study, it is a near certainty that it has
increased the number of PWD globally, likely
significantly. Beyond cases of “long Covid”,
periods of isolation, combined with additional
sources of pandemic anxiety, have contributed to
an overall deterioration of mental health across
populations. This is most evident in younger (ie:
non-senior) age demographics, for whom mental
health is the fastest growing disability type
compared to pre-pandemic sampling.
Consumer Behavior
An effect of social-distancing protocols was an
increase in digital retail spending compared to
in-person. This trend has continued today, with
digital retail expected to grow to 20.1% of all retail
purchases globally in 2024. This is expected to
grow an additional 3% over the next three years.20
The global e-commerce market is also growing
rapidly, with a near 9% expected growth rate in
2024, for a total of $6.3 trillion.
For those who find travel to a physical location
an unwanted effort, these increased digital
offerings have led to improved consumer
experience. However, this has meant that while
some mobility-related challenges have been
improved, barriers involving digital wayfinding
and the processing of large amounts of digital
information have become more important for
driving consumer sales.
Even when consumers do choose to shop
in-person, digital experiences are essential for
organizations to drive sales. In Canada and the
United States, on average, consumers conduct
online research before 61% of their shopping
trips. This is a 25% increase from 2022.21 Even for
physical retail, digital spaces can make – or break
– experiences.
Working Arrangements
The biggest change for employees during the
pandemic was the widespread introduction of
remote work across industries, followed by a
contraction of these arrangements following the
widespread removal of pandemic protocols.
In discussions with PWD, RoDG has consistently
found that the return to office procedures
have created numerous pain points, including
inconsistencies with contracts signed during the
height of the pandemic, and missing equipment
upon the return to office. At the same time, RoDG
studies on the experience of employees with
disabilities have found that the majority of PWD
would prefer hybrid working arrangements. Our
research has indicated that those employees
that are solely remote are concerned about
losing the social aspect of work, including fewer
advancement opportunities resulting from
being “outside informal structures”. These hybrid
arrangements are increasingly the norm at firms
for which work can be done remotely.
Artificial Intelligence (AI)
The biggest disruption in business today is the
growth and integration of AI. This is at least
equally true in disability. Today, industry leaders
are leveraging AI to improve ease of use, both
within and outside disability. This includes
wider access to captioning, generating alt-text
for accessibility, and enabling users to access
customized accessibility offerings.
Captioning
For audio experiences, captioning provides a
key means of accessing an experience even
if it cannot be easily heard. The impact of this
reaches far beyond disability, with up to 50% of
viewers using captioning for their programming
– including 70% of “Gen Z” (those born 1997-
2012).22 AI has enabled organizations to provide
far more widespread and timely caption
20 EMARKETER. 2024. Worldwide Retail Ecommerce Forecast 2024. (https://www.emarketer.com/content/worldwide-retail-ecommerce-forecast-2024)
21 1WorldSync. 2023. 2023 Consumer Product Benchmark Report.
(https://1worldsync.com/2023-consumer-product-content-benchmark/)
22 Preply. 2024. Survey: Why America is obsessed with subtitles.
(https://preply.com/en/blog/americas-subtitles-use/)
17
Global Economics of Disability Report: 2024 | The Return on Disability Group
offerings, improving viewing experience for all,
while simultaneously addressing a significant
accessibility demand. At its best, these captions
can be customized with varying sizes and
contrasts to maximize visibility.
It should be noted that such AI generated
captions remain imperfect. However, user
feedback from past RoDG studies suggests that
imperfect captions are preferable to none at all –
and these AI captions have been improving over
time.
Alt-Text
A core component of digital accessibility is
adding alternative text to images/visualizations
that can be read by assistive technologies,
enabling all users to understand visual
representations, images, memes, etc. While
some large organizations do this on external
facing materials as a matter of process, small
scale content creators frequently fail to do so,
rendering their content inaccessible.
While still in relatively early stages, the ability
to automatically tag images can render far
more user-uploaded content accessible, while
simultaneously reducing the amount of human
time that must be spent on this process. For
context, it took a professional team of 15 writers
to tag 3,500 memes per week, after they had
acclimatized themselves to their platform. For
GIPHY, an online memes site, it took this team 5
weeks, at this pace, to tag all content.23 Further AI
development provides significant opportunity to
make this process more efficient. To be clear (and
generous), this is a work in progress.
Customized Offerings
A key to great experiences is to allow for
offerings to be seamlessly adapted for different
functional requirements, while maintaining
the same core experience for all. One such
opportunity in digital experiences is through AIpowered companion features that can leverage
features such as text-generation to provide
simplified summaries of documents, or to read
them aloud, upon request.
Conclusion
Despite greater awareness of the disability
market, the majority of firms still limit their action
to what is legally required, often directing their
efforts at regulators rather than the market itself.
Within organizations, DEI often struggles to
capture market value in disability, as they typically
lack the budget, scope, and expertise to properly
embed functionality into design teams to create
consistently delightful experiences. Today, the
companies that do this best are typically large
technology companies, who embed design
from disability and ease of use into their core
product/service offerings. Disability-specific, or
adaptive products, do not capture as broad
a market, as they do not add value outside
of a specific disability. There remains a small
window for first-mover advantage; however, the
market dominance of big tech means that other
organizations must seize this initiative quickly. In
the following section, we will focus specifically on
how to better capture the value of disability, both
as a market, and as a means of creating better
experience for all.
23 Scribely. Case Study: GIPHY. (https://www.scribely.com/case-studies/giphy)
18
Global Economics of Disability Report: 2024 | The Return on Disability Group
Capturing Value
Capturing Value in the
Disability Market
We know most firms act in disability only when forced by regulators. We also know that there are companies – frequently those known for human-centered innovation – that leverage disability to add value. How do they do it? How do they move from regulatory compliance exercises – which cost significant capital and add little return – to embedding disability within their organization? The answer is relatively simple: they design for, and more importantly from, disability as they would for any other demographic. And they hold people accountable when failures occur.
Experience, not Compliance,
Drives Value
The most important rule for capturing value in
disability is that experience drives shareholder
returns, not compliance. This is true for both
consumers and employees. PWD do not demand
accessibility. PWD do not demand the minimum
standard, that a product or experience be
minimally useable. They demand consistent,
positive experience, relative to context – what
we call “delight”. As an employee, this can mean
the trade-offs of upward mobility, compensation,
work-life balance, and colleague relationships.
As a consumer, this can mean ease of purchase,
useability, and those “wow” factors that create
brand ambassadors. This is true across the
customer journey, from the initial shop to the
completion of the experience.
Interestingly, PWD users frequently tell us that
this experience is often outside formal regulatory
regimes. Blind users, for instance, frequently
encounter websites and digital experiences that
are technically “accessible” – yet borderline
unusable: a consequence of confusing legal
risk with user experience. Similarly, RoDG has
yet to have a PWD user abort a study because
they could not physically enter a location for accessibility reasons; rather, their core pain
points more frequently are in-store wayfinding,
aisle obstructions, and reach challenges –
those that more mirror the experience of those without disabilities.24 This says nothing for the
host of information processing challenges experienced by neurodiverse users and/or those
with cognitive disabilities, whose needs are
rarely addressed in regulation, yet often have
the greatest downstream application for “gen-pop” users.
Let us return to our example of the concierge
retail model employed by Apple. Here is a case
of minimalist aesthetic design and maximized customer service, to ease the retail experience of
the consumer. In designing this experience, users with low/no vision have a single agent to assist
them throughout their journey, should they so choose, able to open boxes and guide to desired products. For those with information processing challenges, products can be explained by knowledgeable agents, while those with mobility challenges have reach needs addressed. None
of this is an “accessibility” strategy. This is great customer experience that factors in the needs of
24 This is not to say users frequently do not face accessibility challenges at entrances – they do. However, user ingenuity and outside intervention combine in such a way that this rarely prevents users who seek entry to obtain it – even if it makes for a profoundly negative experience.
20
Global Economics of Disability Report: 2024 | The Return on Disability Group
27% of the consumer population in addition to the
modal user.25
The Need for User Data
At its core, designing for disability experience is
no different than any other exercise in humancentered design: users must be consulted
throughout the process, and their pain points
addressed across design iterations. This being
the case, and given that several accessibility
regimes encourage or require consultation with
PWD, why do so many organizations continue
to get this wrong? Frequently, this comes down
to the sources of user data that design teams
work with.
Getting the Data Right
The best data comes from actual users – those
most likely to interact with a product or service in
their day-to-day life. In human-centered design
teams, this insight is obvious: test your design
ideas with its intended market. Yet, this process
rarely happens with disability. Worse, end users
are frequently excluded from what constitutes
“user” data. Instead, design teams are often
forced to rely on advocates, regulators, or even
their own employees who have disclosed a
disability for their user inputs. Unsurprisingly, this
rarely leads to design decisions that provide a
return on investment.
Data Challenges
When organizations do involve PWD directly
in design processes, it most frequently takes
the form of “expert” advice from individual
advocates or advocacy groups. The problems
here are three-fold. First, such advocates are
rarely the intended end users of the product
– not matching the demographic criteria of
the product’s intended audience, but instead
projecting their own experience with disability
onto a hypothetical third party. Second,
advocates or advocacy organizations rarely have
expertise across disability types. Thus, userexperience by proxy rarely covers the spectrum
of disability functionality, and almost never in a
way representative of the target market. Finally,
almost no advocacy group focuses on the actual
user experience, instead focusing on technical
disability requirements and conversations
of identity and disability language. Disability
functionality is thus not leveraged to improve
core experience, but also, costly design decisions
are frequently made that never touch the
intended end-user.
Using regulation as a proxy for experience
creates much of the same issue: adding
functionality by proxy to a hypothetical core user.
The focus is on making the “thing” accessible,
not useable. And, certainly, not with any
consideration of return on investment.
An example of this “accessibility,” rather than
experience, mindset, can be observed at
most self-service kiosks in airports. These
kiosks are frequently designed with an AUX
input for headphones, enabling blind users to
independently check-in for their flight. However,
blind users virtually never encounter these kiosks
during travel experiences: blind users travelling
with a sighted companion are far more likely to
leverage this companion at a kiosk due to the
cumbersome nature of the auditory experience,
while those travelling alone are brought to a
human agent for check-in. Multiple millions
of dollars spent on design and remediation,
no tangible improvement to blind passenger
experience, and no tailwind improvements for
other users.
Before moving on, it is worth highlighting one
additional pitfall when relying on advocates or
regulators at the expense of core users: data
inputs rarely occur during the actual intended
user journey. This means that while a product
may be accessible to users, it ceases to be so
once additional journey elements are added
(or, in the case of our kiosks, the journey itself
precludes the need for the design remediation).
A somewhat trivial example of this lack of journey
consideration is the all too familiar automated
entrance located at the top of a staircase.
25 Defined as the population aged 15+
21
Global Economics of Disability Report: 2024 | The Return on Disability Group
The goal is not to design parallel accessibility pathways, but great core experiences.
Recruiting Users
Relying on end users sounds simple. So why
don’t more organizations do this? Beyond a lack
of consideration of the market in general, most
organizations lack the internal ability to recruit
sufficient PWD that also meet the demographic
criteria of a product or service’s target market.
Moreover, most major market research firms
have failed to consider disability in developing
their own user databases, making external
recruits often outside the budget of most design
teams. This means that even when organizations
want PWD users, they struggle to find them at a
reasonable cost.
There are two main ways organizations can
overcome this user availability issue. The first
is to build their own database
of potential PWD users. This
option is most appealing to those
organizations whose design and
creative teams own all parts of
their operation in house, and who
frequently manage large pools of
users. Knowing that 20-30% of most
user pools will incidentally have a
disability, collecting this data over time can prove
to be an effective option.
However, today, most organizations rely on
third-party research firms to provide user inputs.
To reach end users, organizations must partner
with research firms who have carefully created
large pools of PWD users, across disability types
and demographic criteria. These firms must
also screen this panel to identify professional
advocates. While some user studies may indeed
benefit from including advocates, past RoDG
research has shown that those who self-identify
as advocates have different preferences
into what makes an ideal product or service
compared to PWD non-activists.26
RoDG, for instance, has over 4,000 such
individuals on its PWD panel as of July 2024, and
this number grows continuously. This ensures
multiple demographic criteria can be met, and
that testing/user input is being conducted by the
same group(s) of users. Such a large panel also
allows for efficient recruiting of users for virtually
any study, at far lower costs to design teams, and
in properly designed studies.
User Inputs
Once organizations develop or source pools of
potential users, they must decide when and how
to collect meaningful user input. While there
is not a single best practice, a good rule for
collecting insight from disability is to do so early,
and do so in a way that overlaps with user inputs
from the general population.
In terms of timing user inputs, it should be
stressed that changes in design are often far
less costly early in a design process than later,
with the most expensive being post-release
remediation. For this reason, design teams
should solicit user feedback especially from
those with mobility and/or sensory disabilities in
the early prototype phase, ensuring that changes
can be made while it is still cost-effective to do
so. This better enables design teams to integrate
these functional requirements into core design
elements, rather than create inefficient alternative
paths to useability later in the design process.
Most importantly, this also allows design teams to
leverage these functionalities to improve design
ergonomics for all intended users.
For products or services with a strong information
processing component, such as digital products,
wayfinding, packaging, or financial data, design
teams would be well served to collect user inputs
from those with cognitive disabilities as early in
the design process as possible. This is because
leveraging insights from those that may have
challenges processing complex information
ensures that any information is communicated
as simply as possible. With one client, RoDG
engaged in this process for a new packaging
regime that resulted in simplified messaging –
and materially increased sales.
Regardless of the disability type of the user, two
points are worth underscoring. First, the overall
methods of collecting user input can, and should,
match those of the general population. Whether
this be user tests, card sorts, or any of the other
26 Return on Disability Group. 2024. Media and Accessibility Content Survey. N=612 PWD.
22
Global Economics of Disability Report: 2024 | The Return on Disability Group
tools in the UX toolbox, insights between PWD
and gen-pop must be comparable. There is no
separate disability methodology. Second, the
goal is to understand how different functionalities
amongst the target market shape experience
– both for PWD and the general population.
The goal is not to design parallel accessibility
pathways, but great core experiences. Recent
high-profile challenges in aviation – in which
technically accessible processes exhibited
spectacular breakdowns – are testament to this.
In our experience, design and/or creative teams
sometimes struggle to relate the functional
requirements of PWD to those without disabilities.
For this reason, RoDG recommends integrating
professional researchers and/or designers
with experience working with PWD in UX and
design projects into native teams, especially as
organizations develop their disability “muscle”.
Note the emphasis is on professional, not
necessarily having lived experience with disability
(though the two of course can coincide). The
lived experience must come from the users,
not the user researcher or designer – the part
of the market a product/experience is being
designed for.
Once this process is developed – recruiting users
and integrating them into UX data collection, the
final step is to iterate. As design teams make
changes and new prototypes emerge, both PWD
and gen-pop insights must be collected to ensure
the final product maximizes experience for all
users.
Design From, not For, Disability
To maximize return on investment in the disability
market, organizations must not think exclusively
of delighting People with Disabilities (though this
is a necessary component). Rather, organizations
should be leveraging their learnings from
disability users to find new markets and
improvements within the remaining 73% of the
consumer population.
A commonly used example of this is voiceactivated computing, such as SIRI and various
home or auto companion technologies. While
such technology enables those with, for
example, vision or dexterity challenges to better
interface with technology, it does the same
for the remainder of the population in every
instance in which vision or dexterity are focused
elsewhere. Notably, this includes while driving,
thus enabling responses to text messages or
safer changing of music, or around the house for
those otherwise encumbered by household tasks.
More accessible, more useable, greater return.27
Apply the same thinking to retail environments:
changes that make for easier navigation in a
wheelchair are likely to lead to easier navigation
for those with shopping carts or strollers.
Regulation and Risk
Designing from, and for, user experience allows
organizations to maximize their return on
investment in the disability market. Starting with
user experience, organizations can utilize their
design teams to mitigate the vast majority of their
regulatory risk as it pertains to disability while
generating UX improvements.
At the same time, a wholly user-centric process
is unlikely to fulfill every potential requirement
within accessibility legislation. For this reason,
RoDG recommends organizations start with
user experience, and then “backfill” regulatory
requirements. Web Content Accessibility
Guidelines (WCAG) requirements, for example,
may be a useful tool in design processes, yet
most users do not care about compliance with
a standard. They simply want the “thing” to
deliver the intended experience. They just want it
to work.
Embedding PWD insights into the design process
can allow for more sophisticated conversations
with regulators, thus helping to avoid regulatory
risk. There are instances in which regulatory
standards have not kept up with common use
technologies. While it may be necessary to
add navigational buttons to meet regulations,
27 RoDG is aware that such technology can struggle with various speech-related disabilities. The example is
included for its obvious application to most of the population
23
Global Economics of Disability Report: 2024 | The Return on Disability Group
in parallel with embedded device technology
for touchscreens, over time organizations can
leverage a demonstrable process and data to
ensure regulators keep up with them, not the
other way around. In almost every instance, basic
consumer insights and design aimed at PWD are
ahead of a regulator’s knowledge and capacity.
The Need for Governance and
Senior Leadership
No corporate strategy can succeed without
effective leadership and efficient governance.
This is one of the greatest shortcomings in
disability strategy across organizations. It has
also made even the most well-informed efforts
unsustainable and occasionally futile.
Maximizing returns in disability requires a usercentric approach. Sustaining this means that
disability must be owned by user experience
leaders at the top of an organization. This is true
for both employees and customers. Reporting
must go directly to senior leaders, ideally those
with “C” in their title. This ensures that those
most capable of executing on experience own
this file, and that they do so in an environment
in which they are held accountable for failures
and rewarded for successes. They can then
push design down throughout relevant internal
stakeholders, as close to the user as practical.
Crucially, a user-centric approach cannot live
within DEI. DEI lacks the resources to push the
functional requirements of disability throughout
an organization, especially as it relates to
customers. Disability is first and foremost a
design challenge, and DEI is not the design arm
of an organization.
From Users, Comes Value
The key to unlocking returns in the disability
market – getting disability right – is fundamentally
no different from any other user design project.
User inputs must be collected, integrated into
design, and this process must iterate on itself
before and after going to market. Leaders must
hold process owners accountable for its success.
Getting design right requires the right data. To
do this, insights from PWD must be collected
early, and in parallel with the general population.
This allows teams to make design decisions with
the greatest impact, early in the design process.
Late-stage remediation is costly and should be
avoided.
Where firms lack the ability to properly recruit
users and integrate their functional needs into UX
processes, they should partner with external firms
until they are comfortable fulfilling these practices
in house. At no point should regulators or
advocacy groups stand in for actual users. They
are not the intended market, and their input can
only minimize risk at best, never maximize returns.
And these returns are large – a global population
of 1.58 billion, and a spending power of over
$2.6 trillion in Canada, the E.U., U.K., and U.S.
alone. More importantly, getting this market right
means not just unlocking the spending power
of this market. Insights and resulting design can
be leveraged to maximize experience and fulfill
demand in the general population. The time is
now for innovative thinking and proper userinformed designs to consistently deliver delight
to both customers and employees.
24
Global Economics of Disability Report: 2024 | The Return on Disability Group
About The Return on Disability Group
About The
Return on Disability Group
The Return on Disability® Group is a boutique
insights and design consulting company. Formed
in 2008, RoDG assists clients in unlocking the
value of the disability market for both customers
and employees.
RoDG leverages a panel of over 4,000 People
with Disabilities to conduct mixed-methods UX
research on behalf of clients in both the private
and public sectors. Participants are recruited
directly to match client target markets inside
and outside their current customer base. From
this user research, RoDG provides and executes
design recommendations alongside client
design teams, embedding new, functional utility
in the process. The processes we seed are
intentionally repeatable, allowing clients to scale
learnings throughout their design environments.
RoDG continually updates its offerings,
integrating technologies such as Artificial
Technology (AI) and eye-tracking, to ensure
our insights are at the cutting edge of user
experience.
Our Team

Rich Donovan
Chairman and CEO

Jenn Donovan
Chief Customer Officer

Ken Fredeen
Managing Director

Mark Winward
Managing Director – Research

Alia Ahmed
Analyst – Research

Sen Lingam
Analyst – Research and Operations
26
Global Economics of Disability Report: 2024 | The Return on Disability Group
Accessibility of this document
This document complies with all applicable EN 301 549, WCAG 2.0 and
2.1 Level A and Level AA guidelines for accessible digital documents.
For alternative formats, contact Return on Disability at jenn@rod-group.
com. We always strive for plain language; however, we often cannot
write about conformance and compliance using simpler language
without losing critical meaning. Background material copyright 2011-
2022 David Berman Communications used under limited license.