Macro/Market Study

Employee Turnover

Casually dressed workers in a busy open plan office. Business people working at a modern office.

Disability and Employee Churn1

Costs of getting disability “wrong”2

PWD Churn at Higher Rate

A significant internal obstacle to internal accessibility – that for employees – is understanding potential financial costs, especially those not resulting from legal compliance failures. This can make firms reluctant to act in ways that best consider the needs of their workforce.

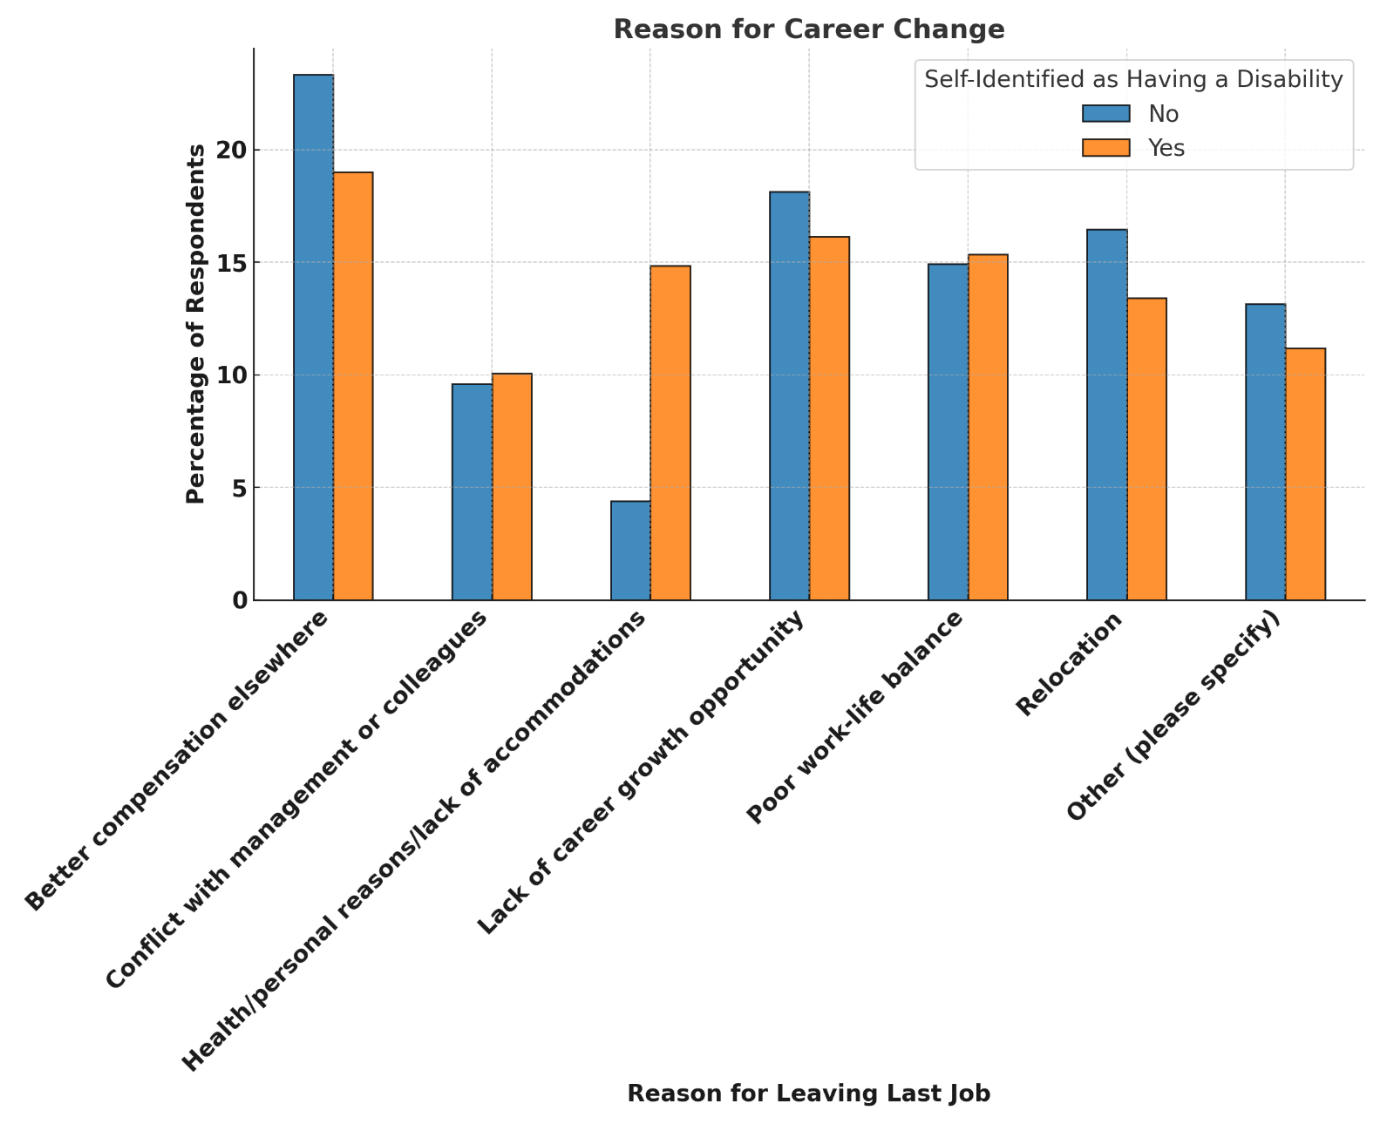
As part of its 2025 quarterly research program, The Return on Disability Group (RoDG) surveyed 1720 Canadians, 700 of whom self-identified as having a disability.3 All participants were currently part of the Canadian labor force. Participants were asked a series of questions about their recent employment histories, including satisfaction with their current employer, how frequently they thought about career change, took steps to seek new employment, and the frequency with which they changed employers (and why).

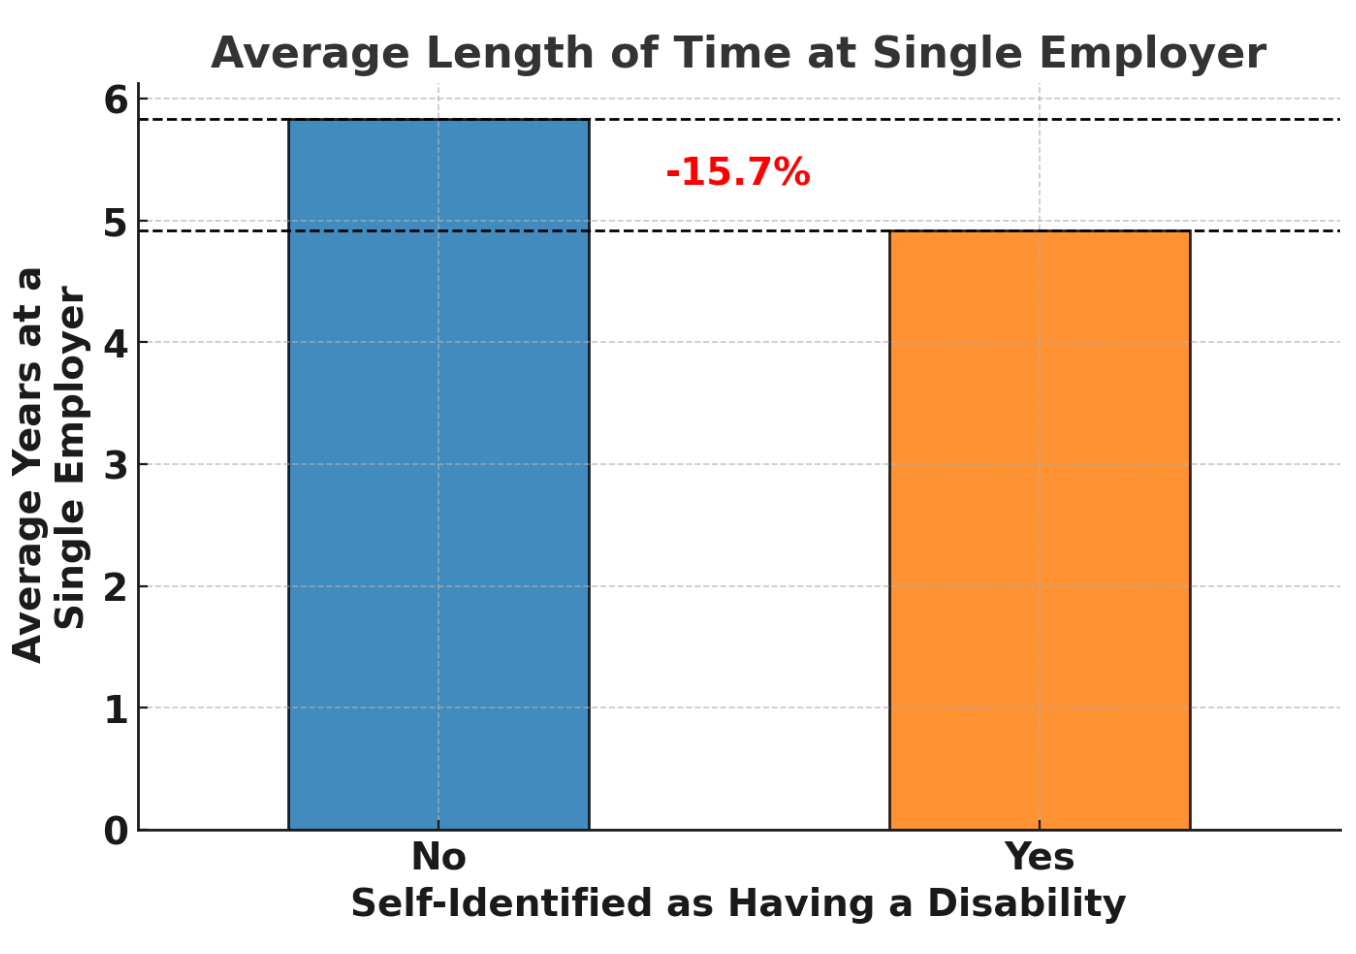
Survey results showed a clear pattern: those with disabilities left their employers more frequently than those without disabilities: spending nearly 16% less time, on average, at a given employer – or about one year less. This equates to a roughly 3% higher average turnover rate per year. This represents material cost to organizations, who must replace talent faster, creating operational gaps in the process.

Figure 1: Average Length of Time at Single Employer
A bar chart comparing the average number of years respondents stay at a single employer before considering a job change, based on whether they self-identify as having a disability. The x-axis represents disability status, with two categories: "No" (without disabilities) and "Yes" (with disabilities). The y-axis represents the average number of years at a single employer. Non-disabled respondents report staying an average of 5.83 years, while disabled respondents report staying 4.92 years. Key Insights: Disabled employees stay at an employer for nearly 1 year less than their non-disabled counterparts. A dashed horizontal line marks the tenure level for each group. A red annotation in the center of the chart indicates a -15.7% shorter tenure for disabled respondents compared to non-disabled respondents. The chart highlights a significant difference in job tenure, suggesting potential retention challenges for employees with disabilities.

Compensation and Accommodations

So why do people with disabilities (PWD) leave their employers more frequently than non-PWD? It is worth emphasizing that both groups indicated the most important reasons for actually changing employers was tied to compensation and opportunity, which accounted for at least one third of career change decisions for both groups. Work-life balance and relocation were also frequent reasons for changing employers, each accounting for around 13-15% of employer change (see Figure 2).

The most significant difference between PWD and non-PWD was the extent that health, accommodations, and personal reasons were motivators for changing employers. PWD cited this as the primary reason for leaving their last job about 15% of the time, compared to less than 5% for non-PWD. This underscores that the higher turnover amongst PWD is tied to disability itself – further suggesting organizational intervention via accommodations can significantly reduce turnover risk. Supporting this, when asked about turnover risk, those without accommodations were 15% more likely to have applied for another job than those with accommodations.

Figure 2: Reason for Career Change
Key Findings: Better compensation elsewhere was the most common reason for career change, with 23.3% of respondents without disabilities and 19.0% of respondents with disabilities citing it. Conflict with management or colleagues was mentioned by 9.6% of respondents without disabilities and 10.1% of respondents with disabilities. Health/personal reasons or lack of accommodations were cited significantly more by respondents with disabilities (14.9%) compared to those without disabilities (4.4%). Lack of career growth opportunity was a notable factor for 18.1% of respondents without disabilities and 16.1% of respondents with disabilities. Poor work-life balance was similar across both groups (14.9% without disabilities vs. 15.3% with disabilities). Relocation was a reason for 16.5% of respondents without disabilities and 13.4% of those with disabilities. Other (please specify) responses accounted for 13.2% of those without disabilities and 11.2% of those with disabilities.

Cost Implications

Replacing employees carries significant costs, with estimates typically ranging between 35%-100% of an individual’s salary. Closing the turnover gap between PWD/non-PWD thus represents significant cost savings opportunities. Assuming an average salary (in Canada) of $66,867, the cost savings opportunity of getting disability right is between $2.3million-6.7million, per 100 employees retained, depending on estimates of employee replacement costs (see Figure 3). For context, 100 employees turning over specifically due to disability (based on this data) is what one would expect for an organization with approximately 20,000 employees.4

Figure 3: Cost Savings per 100 Employees Retained
"Bar chart titled 'Cost Savings per 100 Employees Retained' showing potential savings for employers at different turnover cost levels: 35%, 50%, and 100% of salary. The Y-axis represents cost savings in CAD. The savings values are approximately $2.34M at 35% salary turnover costs, $3.34M at 50%, and $6.69M at 100%."

Why this Matters

Too often, the costs of getting accessibility wrong internally are based on some combination of insurance premiums and regulatory risk. However, failure to properly accommodate employees leads to measurable increases in turnover risk. This creates significant costs. These costs are in addition to the very real drops in productivity and engagement likely to precede such turnover.

Accessibility of this document

This document respects various best practices regarding accessible documents, including our choice of typeface, type size, hue contrasts, margins, document structure, and heading styles.

About the Authors

MarkWinward

Ph.D., Managing Director of Research and Design at RoDG is an experienced researcher in the academic sector, who has conducted qualitative research with under-represented communities in multiple countries and in multiple languages. Drawing on years of research and advisory work with leading organizations—including major banks, telecommunications companies, and global consumer brands, Mark delivers actionable insights that help businesses unlock the full potential of the disability market.

RichDonovan

CEO/Founder at RoDG is a globally recognized subject matter expert on the convergence of disability, user delight, and corporate profitability. He has spent more than 17 years defining and unlocking the economic value of the disability market. He is a person with a disability.

RoDG’s public research empowers executives and policymakers to integrate disability into core business strategy, driving both customer and employee experience. For more research and practical tools, visit www.rod-group.com.

1 This document complies with all applicable EN 301 549, WCAG 2.0 and 2.1 Level A and Level AA guidelines for accessible digital documents. For alternative formats, contact Return on Disability at mark@rod-group.com. We always strive for plain language; however, we often cannot write about topics such as conformance and compliance using simpler language without losing critical meaning.

2 © The Return on Disability Group. All rights reserved. The information contained herein is not represented or warranted to be accurate, correct, complete or timely. This report is for information purposes only and should not be considered a solicitation to buy or sell any security.

3 Return on Disability quarterly survey, first quarter 2025. Note ratio of disability to non-disability is inflated for better statistical comparison of the two groups.

4 This assumes 16% of said organization had a disability (consistent with disability occurrence frequency and employment rates). See Statistics Canada: Labour market characteristics of persons with and without disabilities, 2023. Available at https://www150.statcan.gc.ca/n1/pub/71-222-x/71-222-x2024002-eng.htm

Related Posts

Grounded in users, Return on Disability delivers deep insights into your experiences. We translate new insights into design adjustments that delight from disability.

Executive team meeting at a table.

PWD and AT – Channel Preference – September 2025

There is often an assumption that the shopping preferences and behaviors of Persons with Disabilities

Manager and employee visibly upset.

Neurodivergence at Work – September 2025

A current focus within many HR and accessibility offices is neurodiversity – a nonmedical term

a group of people sitting at a table

Functional Disability vs Identification

In 2023 Statistics Canada released results from the 2022 Canadian Survey on Disability (CSD).3 This